
Citation
Les auteurs
Romain Boulet
(Romain.boulet@univ-lyon3.fr) - Université Lyon 3jean-fabrice Lebraty
(jean-fabrice.lebraty@univ-lyon3.fr) - Université Jean Moulin Lyon3, iaelyon, La. Magellan - ORCID : 0000-0001-5175-7052
Copyright
Déclaration d'intérêts
Financements
Aperçu
Contenu
55 days of lockdown
From the 17th of March to the 11th of May 2020, France implemented strict measures to cope with the covid_19 disaster. Keeping social links was made possible through multiple social network applications such as Facebook, WhatsApp, Zoom, Skype and obviously Twitter. Of course, on permission-less social network, some specific accounts emerged or strengthen their role. Among these roles, influencers are noticeable one. In this paper we aim to answer the following research question: how can we characterize influencers in social networks?
This question is of theoretical, managerial and methodological interest. On a theoretical side, it’s a way to use tool of graph theory. On a managerial aspect, it may ultimately contribute to determine the attribution of an influencer network and even to predict the virality of their messages. On a methodological point of view, we will suggest a structured, academic and replicable process for influencers characterization.
First of all, we have to define what does characterization mean and what is an influencer?
Based upon cyber investigation (Edwards, 2020; Reddy, 2019), we can define characterization as a process leading to provide a structured and as much as detailed view of an element. As it is a process, there are steps. The first step is to define the element that will be characterized. This step is essential as it will determine the quality of the characterization. The second step is to collect the data. As we are going to see, the ease of collecting data varies according the will of the social app editor. The third step is to store these data in a way they can be computed. The final step is to organize the collected data in order to allow the initial element analysis.
Then, before defining what influencer means, we have to remind ourself what influence is. We can define influence as any change to perceptions, attitudes, or behaviors from an individual or a group caused by an individual or a group in a specific context (Boulet & Lebraty, 2018). Influence may vary according to researcher in social science or mathematics and computer science. Thus, on one hand influencers may be seen as a type of celebrities who display part of their lives in a defined purpose. “Influencers are shapers of public opinion who persuade their audience through the conscientious calibration of personae on social media”. (Dhanesh & Duthler, 2019, p. 3). On the other hand, influence means maximizing information diffusion and influencers as the users who contribute the most to this information spreading (Alp & Öğüdücü, 2019, p. 945). To these approaches, we want to add that influencer is a role, or a status. Some users can one time and sometimes unintentionally post a viral message, but that does not mean they are influencers. To be an influencer, users have to be repetitively or recurrently in that position. In that way, there are patterns for influencers. To gain this status, an influencer can be the one who create and spread messages, we will call it a first-creator influencer, or he may be the first to relay and give notoriety to a message, we will call him a first disseminator influencer.
3 key theories
Here, we want to state social networks applications, graph theory and the concept of motivation.
From M. Granovetter (1973), then A.L. Barabasi (2009) to X. Fang and P. Jen-Hwa Hu (2018), social networks and their applications have been studied. Here we will focus on social networks applications defined as a set of entities (individuals, group, bots) and the social relationships among them either they are public or private. Here we will focus on Twitter due to the ease of data collection with their quite open API (Geva et al., 2019).
A graph consists of points or nodes, which are called vertices, and connections, which are called edges. Replacing nodes by user accounts and connections by social relations (followers or likes) allow us to use graph theory to visualize and understand social relations and also to analyze social networks applications. Moreover, many studies link social networks analysis and graph theory (Drobyshevskiy & Turdakov, 2020).
Motivation is an important field of research used in social sciences as psychology or human resources management (Pink, 2011). It explains what motivate people to act. At least 3 types of motivations can be found (Deci & Ryan, 2000; Kuvaas et al., 2017) : intrinsic, extrinsic and extrinsic internalized. Extrinsic means that someone is performing a task in order to have outcomes. On the other hand, in an intrinsic motivation someone performs a task for the pleasure to perform this task in itself. The third category is a hybrid one where someone starts by waiting for the outcomes but then begin to appreciate the task for what it is.
#Lockdown: Gathering Data
We based our work on the “lockdown observatory “project lead by Prof. C. Benavent (2020; 2020). This project aimed to collect all the tweets linked to the lockdown related to the covid19 disaster to analyze the feelings and test different methodologies in text, or emoticons as well as images processing. So, during 55 days (from March 17th to May 10th) tweets were collected based upon #confinement and the different # related. The result was a 1.6 GB of twitter data representing more than 2.5 million of tweets written by more than 570,000 users among which nearly 400,000 are original messages (not retweets) written by nearly 100,000 users.
On a methodological aspect, this study is of interest because it uses sequentially a quantitative and a qualitive approach. Analyzing influencers does not just require to collect data and count the maximum number of retweets by a user but, need to perform a qualitative analysis of the messages in themselves as well as the way the influencer present himself.
We emphasize that the objective of this scientific article is methodological (including the availability of a source code). Therefore, this article is not intended to name the users whether or not they were politically oriented, attached to mass media or not. This is why, even if some characteristic tweets are put forward to illustrate our remarks, no account name will appear in this paper.
Looking at influencers through a lens
Our results are of two types, quantitative and qualitative.
Parsing data about influencers
First, our data analysis results in finding the top influencers, their messages and their properties.
A sentiment analysis based on the French NRC lexicon (Saif & Turney, 2010) performed on the 391,000 original tweets (those are tweets that are not retweets) allows to assess which kind of content is more likely to be spread: Figure 1 (up left) shows clearly that tweets with negative sentiment like fear or anger were more retweeted than tweets with positive feelings like joy; message with a dominating feeling of anticipation is also more likely to be retweeted a lot of times. We can observe a similar phenomenon among the messages retweeted more than 500 times (Figure 1, bottom) with however a less pronounced difference between feelings like joy, surprise, trust and the other ones. However, the feeling of anticipation seems to be a characteristic of highly retweeted messages compared to the other messages. An example of a message containing a feeling of anticipation, is a message giving important information regarding the next step in the future of this dynamic period. Concerning the container, tweets with a media like photo were 2.7 times more retweeted than a tweet in plain text but this ratio falls to 1.3 for the messages retweeted more than 500 times.
Figure 1 : Average number of retweets by dominating sentiment present in the message. 1st bar chart: The average is computed among all the tweets that are not retweets, including tweets that were never retweeted (about 2/3 of messages are never retweeted). 2nd bar chart: The average is computed among all the tweets that are not retweets and retweeted less than 500 times. 3rd bar chart: The average is computed among all the tweets that are not retweets and retweeted more than 500 times.
Different news facts don’t generate the same number of reactions and therefore the number of tweets and retweets may vary according the news/event context. The daily time series of the average number of retweets of tweet written on a given day plotted in Figure 2 shows this phenomenon. A tweet might be highly retweeted if it fits a current trend. The peaks we can observe are for instance:
- March 20th: French national assembly pass a law about sanitary emergency
- April 25th: No national or international special news related to lockdown or covid19 disaster
- May 3rd: National map of lockdown exit presented by national authorities
Figure 2 : time series of the average number of retweets of a message (the timestep is 1 day).
Some statistics about users who wrote highly retweeted messages are exposed on Table 1. This shows that users who wrote highly retweeted messages were already popular users on Twitter since they have a significantly higher average number of followers and friends. Since a user evolves in a social network, a network analysis is performed and exposed on the next subsection.
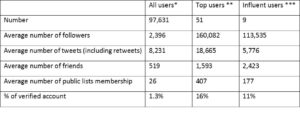
Table 1 : some statistics on two groups of users: *all users having written at least one message in the context of this study, **users having written at least one message in the context of this study among the one hundred most retweeted messages (the 100th most retweeted message has been retweeted 2048 times). *** users having written more than 10 times a message retweeted more than 500 times. The average number of followers, of tweets, of friends, of lists is not dependent on the context of this study (all the twitter social network is considered).
And from the network point of view?
The network point of view is twofold:
- users evolve in the Twitter social network where the “social link” is defined by the relationship “being a follower”.
- Messages are retweeted by users. This creates link between two users (the creator and the spreader). This link may not be formalized as a follower link but it reveals an affinity between the two users, this affinity link is even stronger if a retweeter is a first retweeter
The graph induced by the “follower” relationship among the 1448 users who wrote a message retweeted at least 50 times has a largest connected component of 344 users and 431 links. This component contains 6 influent users (who wrote at least 10 times a message retweeted at least 500 times). We can see on Figure 3 that this network is sparse and therefore communities are well visible and are mainly built around vertices with high degrees (users with a lot of followers). Moreover, influent users that we highlight in this study do not form a single well-connected pole but each has its own sphere of influence (supporting the previous idea of communities gathered around influent or popular users). Through their influent or popular users, we can give sense to some communities: some are mainly focused around some media or journalist account, others are focused on political groups or leaders, we may also find humor and popular science.
Figure 3: Largest connected component of the network between users who wrote a message retweeted at least 50 times. There is a directed link from user A to user B if B is a follower of A. Red (resp. orange) vertices are users who wrote at least 20 times (resp 10 times) a tweet retweeted at least 500 times. Dark blue (resp. blue, light blue) are users who were at least 20 times (resp. 10, 5) among the first retweeters.
Adding a qualitative interpretation
We consider the “retweet link” by extracting the early retweeters, they are users that were among the 10% first retweeters of a tweet at least 5 times. Focusing on the first retweeter, some interesting patterns clearly appear:
- A same user is most of the time the first retweeter of a given user (and their usernames are similar)
- A small set of users are always the first retweeter of a given user
- A user who is the first retweeter of messages from more than 10 different other users
- A user for whom when he is the first retweeter of a message, it is a message originating from a single account (but this account may have other first retweeters for other messages)
We then looked deeper to the content of the tweets and specifically if:
- All the # are related directly to the covid_19 or lockdown issue
- There is a funny or ironic remark
- The content of the picture is related to the lockdown directly or to another fact
- There is a catchy picture
- The nature of the content of the tweet is factual, philosophical or perception oriented
Crossing metadata of the tweets (time, retweet etc.) and these criteria revealed the following 5 courses of actions from the influencers:
- CoA1: Add related Hashtag
- CoA2: Use Humor or friendly pets
- CoA3: Deep thoughts
- CoA4: Common sense “what we all know but do not say”
- Coa5: First to say
Here we want to present 2 of them as illustration.
Course of Action 5: the first retweeter. In that case, a well establish influencer is the first to send a news about a sensitive topic. For example, the non-re-opening of high schools has reach Top 7 of retweeted tweets. In that case, the message is short and do not need any specific image or video as it is shown below
In that case, the tone is fact oriented with a sentiment of anticipation. There is no picture and the influencer is a well-established influencer having more than 365K followers. This influencer is not related to an individual but to a group that can be qualified as “conflict watcher”. They have an existence on other platform such as Facebook, YouTube or a website. Regarding Botometer (https://botometer.iuni.iu.edu/), the account is not completely automated but has posted more than 11K tweets in 6 months.
Course of Action 2: the weight of the image.
This course of action is very interesting because, as we are going to see, it helps an influencer and it allows a non-influencer to become famous for once. We previously showed the importance of humour (Boulet & Lebraty, 2018).
This tweet for example is Top4. In that case, the influencer is a well-known TV presenter of a scientific show.
It contains a humoristic presentation of a TV show not focused on covid19 but related to popularize science toward young people. This influencer has more than 300k followers and accounts on various platforms (Facebook, Instagram, Youtube, Website). According to botometer, there is no automation and messages are manually posted.
But, using humour and even adding a catchy picture may lead to be retweeted but not to be an influencer as the following example shows.
Here, this user re-uses a catchy image or video: an initially TikTok video of a cat playing and winning at Tic-Tac-Toe. Then this user added an humoristic message. That short video and the message directly related to lockdown became quite viral. This was the 2nd best retweeted post during 55 days.
Nevertheless, this is not enough to become an influencer. Even if this user has accounts on other platforms (Instagram, Facebook and a website – not reachable when accessed on May 30th 2020), he still has less than 350 followers in Twitter (same volume on the other platforms) and posts messages by himself.
But, we think, that this course of action may help to have popularity and to be the first step to become a future influencer.
In addition, we found 5 courses of action from influencers. An interesting point is that we noticed that the same pattern may be used inside different communities. This means that there is a general influencer strategy that can be applied regardless of the orientation of the community. But, we will have to go deeper to be sure that there is no link between a type of community and an influencer course of action’s pattern.
Proposing a matrix to conclude
We start this article by asking the following research question: how can we characterize influencers in social networks? We can answer by proposing that an influencer can be characterized by the course of action he uses to send highly retweeted messages. We defined 5 courses of action.
In order to go further in the characterization, we can add the criteria of motivation. It means that we can apply the 3 types of motivations to the influencer regarding a specific event. In addition, we may characterize an influencer by applying the following matrix:
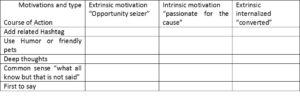
Table 2 : influencer characterization matrix
Regarding feelings, there are dominant and secondary feelings among all tweets. Generally, all influencers messages follow dominant feelings. This is interesting, because, it may means that influencers are not opinion leaders but opinion followers or at least amplifiers. Their behavior could be to detect early trends and then to use their position to spread new feelings.
Two further directions can be evoked.
First, it could be relevant to analyze influencers pattern in order to determine if different influencers are not in reality the same avatar, meaning the same individual or group of individuals beneath different accounts. This could be intentionally made to spread the same message toward various communities.
Second, we could go further in content analysis of messages too. We noticed for example that humoristic messages do not have the same grammatical structure as politic oriented messages. Regarding the context, we also noticed that depending of the nature of an influencer the main idea inside the message is or is not contextualized.
Finally, this covid_19 disaster and the mandatory lockdown that has followed, constitute an opportunity to analyze social networks users’ behaviors. We just hope that learning from these studies will help containing the next phases of this disaster.
Bibliographie
Alp, Z. Z., & Öğüdücü, Ş. G. (2019). Influence Factorization for identifying authorities in Twitter. Knowledge-Based Systems, 163, 944–954. https://doi.org/https://doi.org/10.1016/j.knosys.2018.10.020
Balech, S., Benavent, C., & Calciu, M. (2020). The First French COVID19 Lockdown Twitter Dataset.
Barabási, A.-L. (2009). Scale-Free Networks: A Decade and Beyond. Science, 325(5939), 412–413. https://doi.org/10.1126/science.1173299
Boulet, R., & Lebraty, jean-fabrice. (2018). A New Influence Measure Based on Graph Centralities and Social Network Behavior Applied to Twitter Data. In Communications of the Association for Information Systems (Vol. 43). https://doi.org/10.17705/1CAIS.04321
Deci, E. L., & Ryan, R. M. (2000). The “What” and “Why” of Goal Pursuits: Human Needs and the Self-Determination of Behavior. Psychological Inquiry, 11(4), 227–268. https://doi.org/10.1207/S15327965PLI1104_01
Dhanesh, G. S., & Duthler, G. (2019). Relationship management through social media influencers: Effects of followers’ awareness of paid endorsement. Public Relations Review, 45(3), 101765. https://doi.org/https://doi.org/10.1016/j.pubrev.2019.03.002
Drobyshevskiy, M., & Turdakov, D. (2020). Random Graph Modeling: A Survey of the Concepts. ACM Computing Surveys, 52(6), 1–36. http://10.0.4.121/3369782
Edwards, G. (2020). Cybercrime Investigators Handbook. John Wiley & Sons.
Fang, X., & Jen-Hwa Hu, P. (2018). Top persuader prediction for social networks. MIS Quarterly, 42(1), 63-A14. http://search.ebscohost.com/login.aspx?direct=true&db=bsu&AN=127748822&lang=fr&site=ehost-live
Forestier, M., Stavrianou, A., Velcin, J., & Zighed, D. (2012). Roles in Social Networks: Methodologies and Research Issues. Web Intelligence and Agent Systems, 10, 117–133. https://doi.org/10.3233/WIA-2012-0236
Geva, H., Oestreicher-Singer, G., & Saar-Tsechansky, M. (2019). Using retweets when shaping our online persona: topic modeling approach. MIS Quarterly, 43(2), 501–524. http://10.0.98.212/MISQ/2019/14346
Granovetter, M. S. (1973). The strength of weak ties. The American Journal of Sociology, 78(6), 1360–1380.
Kuvaas, B., Buch, R., Weibel, A., Dysvik, A., & Nerstad, C. G. L. (2017). Do intrinsic and extrinsic motivation relate differently to employee outcomes? Journal of Economic Psychology, 61, 244–258. https://doi.org/https://doi.org/10.1016/j.joep.2017.05.004
Monnot, J., & Benavent, C. (2020). #confinement : Le masque au centre des conversations, jour à jour. Management et Datascience, may(0013168).
Pink, D. H. (2011). Drive: The Surprising Truth About What Motivates Us. Penguin Group.
Reddy, N. (2019). Practical Cyber Forensics. Apress.
Saif, M., & Turney, P. (2010). Emotions Evoked by Common Words and Phrases: UsingMechanical Turk to Create an Emotion Lexicon. Proceedings of the NAACL-HLT 2010 Work-Shop on Computational Approaches to Analysis and Generation of Emotion in Text.