Résumé
Industrializing Data Science projects in business lines results from a transformation that takes place from strategic scoping to operational management. By using a learning base, it is possible to predict with performance the success or the failure of future projects in the pre-scoping phase. Industrializable projects can thus be correctly predicted by weighting the following six criteria: the business question, the business mandate, the business availability, the "Data" competences, the quality / Data quantity and the Data monitoring. On this core, the design of a Predictive Score Card evaluation tool allows an optimized projects pre-scoping.Citation : Potelle, H., & Leblond, L. (Oct 2018). How to succeed in data science projects industrialization ?. Management et Datascience, 3(1). https://doi.org/10.36863/mds.a.4717. Les auteurs : Copyright : © 2018 les auteurs. Publication sous licence Creative Commons CC BY-ND. Liens d'intérêts : Financement : Texte complet
Introduction
In recent years, in order to generate significant revenues, many companies are experimenting with their Data Science projects implementation. These are projects aimed at rationalizing decisions by exploiting massive data. In 2016, a Forrester study predicted that the turnover generated by the « Data » would increase by 27% per year until 2020 to reach $1.2 trillion (e.g. McCormick et al., 2016). With this promise, Chief Information Officers (CIO) have invested in « Data Lakes » to stock store data generated by industrial activity (e.g. pre-sales, engineering, production, sales and after-sales). In order to extract the expected value, these CIOs have also defined organizations dedicated to the « Data » whose designations are not missing « Data Plant 4.0 », « Data Factory », « Data Lab » or « Data Fab ». Are their approaches efficient? What are the success or failure factors of the Data Science projects that have been launched?
Data Science relies on a methodical extraction of multidimensional knowledge internal or external to the company. All functions are concerned by its application: Marketing, Communication, Finance, Design, Manufacturing, Human Resources, etc. In order to clarify the elements needed for efficient implementation, e.g. Potelle (2018) proposes a pyramidal representation describing three principles and seven key concepts of « Data Excellence » (Illustration 1).
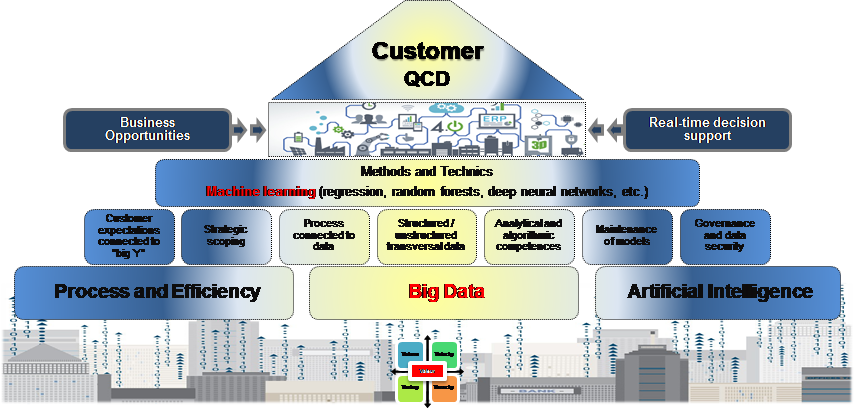
Illustration 1. Pyramid of Data Excellence
Process and efficiency − Data comes from business process analytics for customer satisfaction. These processes must allow the company to democratize the use of « Data » in decision-making.
Big Data − Its purpose is to deal with the « 5V » that is the massive volume of data, the velocity with which data is acquired, the variety of data presented in the form of text, image, sound and video and finally the veracity that refers to the quality and obsolescence of the data to be considered. However, the biggest challenge for companies is a fifth « V » attributed to extracting the « value » of the data (e.g. Gandomi et Haider, 2015).
Artificial intelligence − A set of augmented intelligence tools that includes all machine learning techniques, it gives Data Science the means to accelerate the intelligent exploitation of all available data to monetize them.
Customer expectations − They are the main indicators, called « big Y », which should lead to efficiency. If they are influenced by explanatory factors induced by the process, then they are predictable.
Strategic scoping − It determines the relevance of business questions or business mandates that must be addressed in any Data Science exploitation project in order to increase the probability of industrializing experiments. The strategic framework must be rigorously evaluated around discriminating criteria.
Data process − Data are connected to processes well before information systems. It must therefore to keep in mind that processes must be identified and mapped in the process mapping form in order to select the relevant data that feed an expected result.
Structured data vs. unstructured data – We have to be able to simultaneously exploiting structured or unstructured data that is not limited to a business unit, department, or management.
Analytics and algorithm − Data Science requires analytical and algorithmic skills. Analytical competence concerns the knowledge required for data processing using traditional techniques of descriptive and inferential statistics and more specifically a knowledge of machine learning. The algorithmic competence, meanwhile, refers to the ability to implement using dedicated languages models from previous technics and adapted to the context of application.
Maintenance of models − It guarantees the durability, the performance and the efficiency of the operating process. This maintenance concerns formalized algorithms in the project phase and aims at ensuring that changes in contexts related to new products or new markets have not affected the quality of the predictions.
Data governance − Governance and data security are both the weapon and the shield for delivering Data Science models in an organized and risk-free way in a business context. Data governance makes it possible to identify, classify, manage and control data with clearly defined and shared decision-makers within the organization.
If these pillars are indispensable for the reasoned implementation of Data Science projects, the question arises of the discriminating criteria that make it possible, during the subject’s qualification phase to detect the success or failure of those that are will turn into industrialized projects. « By definition, a project is industrialized when a Data Science operating process is implemented for a daily business activity. »
The « Data » pre-scoping method proposed in this paper exploits historical projects that have been described as the success or failure of industrialization. A supervised classification has produced a predictive detection rule for industrialized versus abandoned projects. A pre-scoring process and a scoring tool labelled « Predictive Score Card » are now used to enable Data project managers to qualify selected subjects and thus optimize the expected profitability by putting in project those meeting the expected criteria.
Background of data science projects
Few data projects are industrialized
In April 2018, Google listed more than 41 million Web pages devoted to the « success of Data Science. » While a survey of 1000 decision makers by Capgemini reveals that 64% of companies consider Big Data as a competitive lever (e.g. Capgemini, 2015), only 13% of them have projects in production. These initiatives are only in 27% of the cases described as successful and in 8% of the cases described as great successes (e.g. Aufray, 2015). A study by McKinsey (e.g. Balasubramanian et al., 2017) reveals that the results of Data Analytics projects in the field of insurance with strong impacts could only be observed in one out of six cases. Yet, investments were up to $ 80 million a year, and more than half of the business leaders mentioned Data Science in their five priorities. What are the reasons for these failures? Although multiple, five recurring causes are cited by large international consulting companies. This information was collected from surveys of decision makers.
The first failure cause is the lack of clear business use cases that make it difficult to implement concretely in experiments or pilots (e.g. Lefebure, 2016). Indeed, the Data Scientists do not have sufficiently precise information on the way in which the operating process « Data » should be executed by both the activity and decisions business area.
The second cause is the lack of a profitable business goal « Profit & Loss » and the lack of return on investment (ROI) metrics that do not indicate what the real benefit is linked to business strategy (e.g. Vaillant, 2018). On the one hand, the results indicators for the Data initiatives are not sufficiently qualified and quantified. On the other hand, they are not sufficiently challenged or formalized to measure a degree of contribution to the company’s strategic indicators.
The third cause is the lack of skills in the company that does not allow in-house to master Big Data technologies such as Hadoop (e.g. Fléchaux, 2017) or to apply Agile project methods such as Lean UX or DataOps. These methods focus on collaboration between project actors, task orchestration, quality, security and data quality (e.g. Blokdyk, 2018). The factor « Competence » is observed on the one hand, in the lack of autonomy of the business players and on the other hand, in the low speed of projects execution. As a result, milestones are neither validated nor blocked and the project’s “work in progress” status remains unclear.
The fourth cause concerns the lack of visibility on business resources availability in projects (e.g. Galiana, 2017). For example, collaborators or managers may lack of time to collaborate with Data Analysts or Data Scientists, although paradoxically these managers are the requesting clients. Their unavailability impacts, on the one hand, the collection phase dedicated to relevant data identification connected to the use case and, on the other hand, the lack of time degrades the exploitation process appropriation in the “Test&Learn” phase. This prevents a quick measurement of the effectiveness and use case relevance.
Finally, the fifth cause is the difficulty for accessing to quality data. It constrains or even blocks the implementation and « analytical » databases administration built to answer to strategic analysis questions and not to daily life management activities (e.g. Balasubramanian et al., 2017). This data quality is however essential for the decisions quality (e.g. Zaïdi-Chtourou, 2018).
These different sources of problems damages the ability of companies to industrialize their data initiatives. Achieving the projects industrialization requires the implementation of a data production system similar to that of industrial production inspired by Lean methods. This system have to make it possible to deliver optimized algorithms in order to serve the company’s business model (e.g. Voguels, 2017). As the consequence, efficiency industrialization requires automating repeatable (e.g. McKendrick, 2018) and enterprise-scale (e.g. Ronanki et al., 2016) analytic processes with a platform of Data Monitoring Process − DMP).
Studies that report those industrialization difficulties are however, limited due to opinion ways results and few factual observations collected on the projects field. These studies do not have a project measurement system that is considered from end-to-end on both qualitative and quantitative aspects. As a result, few information can be used to propose effective improvement actions. By allowing to the « Data » project manager to understand, from the pre-scoping phase, the key success factors, we give, for our part, an operational perspective to start the project implementation with the necessary requirements.
A Project data science is scoped and structured
Before being put into production (Run phase), a Data Science project goes through different cycles of maturities such as experiments (Proof of Concept − PoC), pilots (Proof of Value − PoV), or industrializations (Build phase). To sum up, we propose a Data Science project’s life cycle based on the steps of the Cross Industry Standard Process for Data Mining − CRISP-DM. A consortium of NCR, SPSS, and Daimler-Benz companies created and described an approach commonly used by Data Mining experts (e.g. Chapman et al., 2000), page 14).
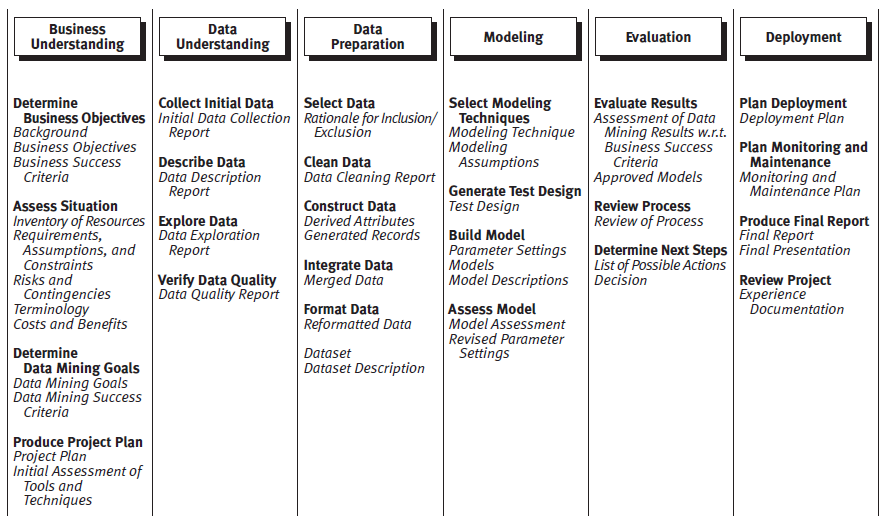
Figure 1. Phases and deliverables associated with the CRISP-DM model (Chapman et al. 2000)
CRISP-DM contains six steps in some of which can iterate between them. The scoping step describes the business understanding expectations in order to formalize the quantified and valued results as well as the project plan. The data comprehension step defines the collection plan up to the data quality evaluation connected to the business question. The data preparation step aimed at selecting and cleaning up the data in order to build-up a workable structured database. The modeling step is the hard core of the Data Science business by selecting techniques and by building models related to the business need. Regardless of the data, the model quality depends heavily on the precision level of the business question asked. The evaluation or the « Test & Learn » step analyzes the business scenarios in order to understand their performance and to consider insight with alternative scenarios. Finally, the deployment step measures the real models opportunities and provides the monitoring device of the operating process. Current practices recommend using closed-loop learning processes to accelerate the speed with which the best knowledge is extracted (e.g. McCormick et al., 2016).
Methodology – Prediction Model
The six prediction criteria
By combining our own feedback from fifty Data Science projects carried out in the PSA Group with the recurring failures causes mentioned in the studies cited above, we have selected the following six criteria. Those seemed potentially discriminating to predict a Data Science project industrialization during the pre-scoping phase.
Business question − It aims at challenging the project applicant according to an efficient and profitable business objective. A business objective must clearly represent, as a key performance indicator form, the project’s output variable. The business question is perfectly identified when a “Profit & Loss” or ROI metric has been formalized.
Business mandate − It aims at assessing managerial issues. It must express a managerial willingness to provide concrete sufficient resources involved in a « Data » exploitation. It is necessary to study means developed in the exploitation process to assess the probability of industrialization. The business mandate is clear when the future project is under quality assurance with a “ready now” budget close to a business contract.
Resources availability − It aims at evaluating the project feasibility according to a business involvement level granted. This involvement degree should specify very concretely the “Full Time Equivalents” (FTEs) available overall the project period. Resource availability is optimal when 100% of FTEs are available during overall the project period.
Data Competences − It aims at evaluating the feasibility of the project according to the level of a provided professional involvement. Business competencies must be high enough to apply the proposed « Data » solutions in terms of cost, quality and delay. Competences are optimal when the resources are fully autonomous to be able to realize the project of Data Science.
Data Quality / Quantity − It aims at evaluating the technical means to allow an industrializable exploitation. Quantity and Quality criteria refer to measurement, historical sample size, observed variability and Data Monitoring. Data is in quantity and in quality sufficient one the project has an « analytical » database.
Data Monitoring – It aims at evaluating the robustness over time of the process industrialization in daily activity. The ability to industrialize is directly related to the performance of the dedicated management device. Administration is optimal when the business has both a database called « Application Programming Interface » and its resources to manage the repository.
Database and criteria quotation
Each of the six preceding criteria has specific properties for each maturity level of a CRISP-DM Data Science project (Figure 2). These properties, whose importance is represented by circles in black, should facilitate the production of key deliverables expected at different stages.
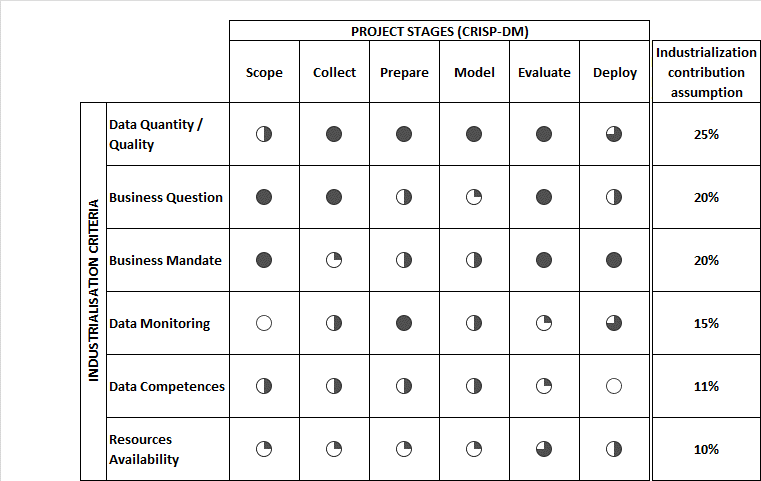
Figure 2. Importance of prediction criteria to industrialize Data projects according to the project stages.
The construction of the prediction model is based on available data from thirty-nine PSA Group projects, which were either abandoned (n = 18), carried out without industrialization (n = 13), or actually industrialized (n = 8). By definition, a project classified as « industrialized » has completed step 6 of the CRISP-DM model’s « deployment » (e.g. Chapman et al., 2000) and validated the associated deliverables (deployment plan, monitoring plan and maintenance). A « realized » project has reached step 5 of the « evaluation » (model’s performance assessment and its implementation) but has not formalized the deliverables of the deployment phase. A project classified as « abandoned » stopped before step 5 without producing the associated deliverables and is therefore classified as « no action ».
These projects have been directly piloted or supervised by the same PSA Group project manager. The projects cover topics that are representative of the PSA Group’s businesses (Sales, marketing, engineering, manufacturing, quality and human resources). In order to respect the rules of confidentiality, neither the titles nor the projects description will be mentioned.
Supervised learning was thus able to be carried out from a rating, by the same evaluator (in order to minimize the measurement system variability). He quoted the initial maturity level of these projects on the six criteria previously described and supposed to be independent. The six criteria each include five levels of maturity from low to high (Figure 3).
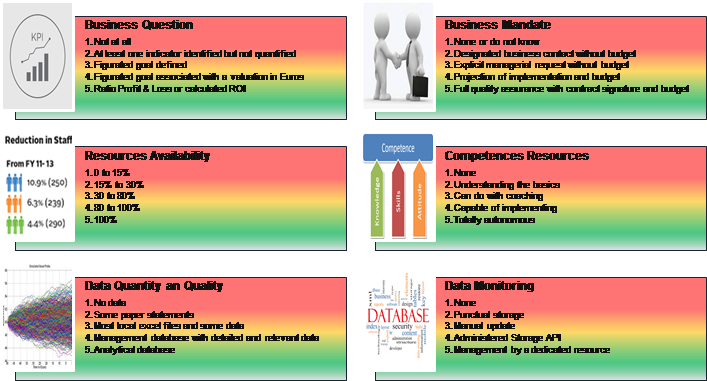
Figure 3. Terms for the six criteria
Each level corresponds to concretely observable situations in the documentation provided by the project plans. For example, for the « identified business question » criterion, a low level corresponds to « no indicator at all » and a high level corresponds to « quantified objective associated with valuation in Euros« . Each modality thus has a precise, concrete and verifiable operational definition used as a scoring grid.
Prediction model building-up
The prediction of the project status (Industrialized versus Realized or Abandoned) is based on the construction of a synthesis criterion building-up, a weighted sum (coded from 1 to 5) of the six criteria’s maturity levels. These weights were, at first, given a priori « intuitively » according to the importance perception of each criterion, then, in a second time, calculated by respecting the relative weights of the area between the curve ROC and the diagonal determined for each of the six criteria. Let remember that an area under this curve of 100% reflects a perfect discriminating power of a criterion and an area of 50% reflects no discrimination power of this criterion (e.g. Tufféry, 2012). In addition, the more a criterion is predictive, the more its weight reflects its importance in the synthesis criterion. The discriminating power of this synthesis criterion is also evaluated by the area under the ROC curve.
Once this synthesis criterion (intuitive or not) defined, the determination of an optimal threshold on this criterion is carried out by minimizing the error rate, the false positive sum and the false negatives sum of the confusion matrix (e.g. Tufféry, 2012). This determination makes it possible to discriminate, on the one hand, from the industrialized projects of the others (« GO » threshold) and on the other hand, from the abandoned projects of the others (« NO GO » threshold). A double coding (Table 1) is thus determined to classify the projects within the three categories « industrialized realized or abandoned ». For example, Project 4 indicates that its synthesis criterion (3.84) is between the No-go threshold (3.27) and the Go threshold (4.08) and is therefore correctly predicted in the « realized » category. »
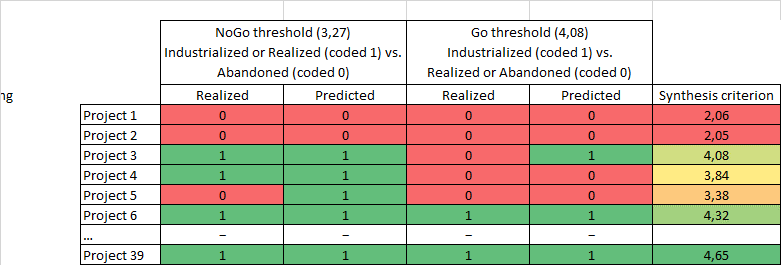
Table 1. Double coding method of the learning base according to the thresholds
According to the study objectives, the synthesis criterion is calculated to distinguish the industrialized projects from the others (realized or abandoned). In addition, its application to discriminate abandoned projects of others has no reason to be optimal. Given the number of projects, the model’s discriminating power could not be evaluated on a sample test.
Results
Data competences and business mandate weigh the most
Figure 4 indicates that the criteria’s weights are not distributed in the same way between the « intuitive » weighting and that calculated by the predictive model. Indeed, according to our experience, the criteria « business question » (20%), « business mandate » (20%) and « Data quality / quantity » (25%) seemed preponderant to us because of their contributions to the deliverables achievement defined at each stage of a CRISP-DM Data Science project. The criterion weight « Data competence » turns out to be the highest (23.5%) and is twice as important compared to the « intuitive » weighting (10%). Similarly, the criterion « resource availability » weighs almost twice as much with the calculated weighting (18.1%) compared to the « intuitive » weighting (10%). The criterion « business mandate« , the « business question » and the « quantity / quality of data » are in the same order of magnitude between the two weights.
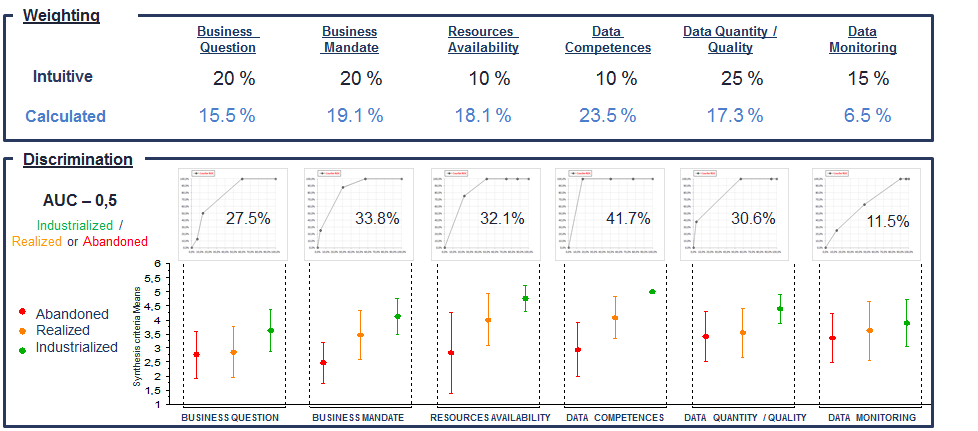
Figure 4. ROC Curves with determining weights
Criteria on their own have a low discrimination power
The criteria taken individually are not very discriminating (second part of Figure 4). In fact, with a few exceptions, the intervals with plus or minus one standard deviation on the synthesis criterion overlap between industrialized projects, realized and abandoned. These results therefore indicate that it is difficult to attribute discriminating power based on a single criterion in particular.
The synthesis creterion is discriminant
The confusion matrices (Figure 5) with calculated weights indicate that the model predicts well the projects based on the Go and No-go thresholds with error rates of 0% and 13%, respectively. The intervals plus or minus one standard deviation of the calculated synthesis criterion do not overlap. These elements prove the discriminating character of the calculated synthesis criterion. Finally, the model with the « intuitive » weightings is less efficient, which indicates that the determining weights method is relevant.
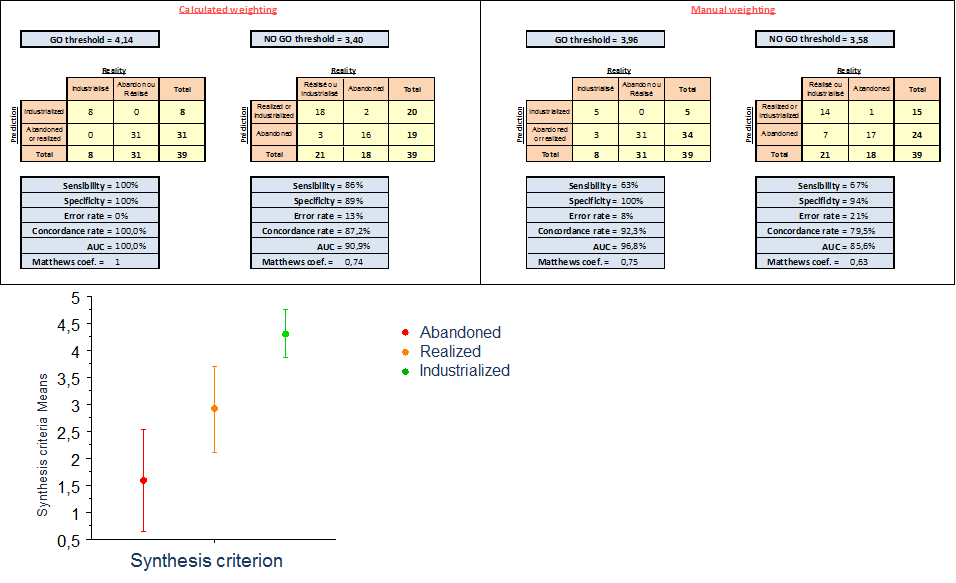
Figure 5. Ranking performance based on manual versus calculated weightings
Industrialization of the prediction model
We aimed at exploiting the synthesis criteria in the real Data Science project management activity. Therefore, we implemented the previous prediction model in the subject qualification process. We built a « Predictive Score Card » tool allowing the « Data » project manager to evaluate incoming subjects from the pre-scoping phase. This « predictive card score » objectives is to (1) evaluate the projects maturity and predict the future projects industrialization, (2) propose concrete recommendations before launch and (3) manage a waiting line of potential « Data » topics.
To evaluate the maturity of the subjects, the project manager rates each criterion straightly in a dedicated form. It also has very specific recommendations for proposing improvements. The project manager then has a visualization radar (Illustration 3) to interpret the criteria’s maturity levels of each subject. The « red / orange / green » zones were determined in relation to the thresholds on the synthesis criterion. This radar also allows the applicant more effective communication to « challenge » his request.
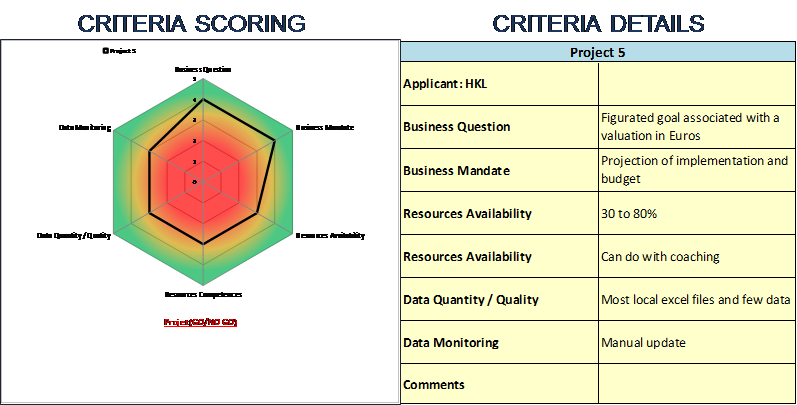
Illustration 3. Radar visualization of the criteria_s maturity level
As long as each criterion does not reach the green zone of the radar, the subject is not considered as industrializable (No-go). The project manager must provide improvements during the pre-scoping phase, achieving the required levels. If this is not possible, he must stop the project. The project manager also has a bar graph that ranks the projects being qualified according to their levels on the synthesis criterion (Illustration 4).
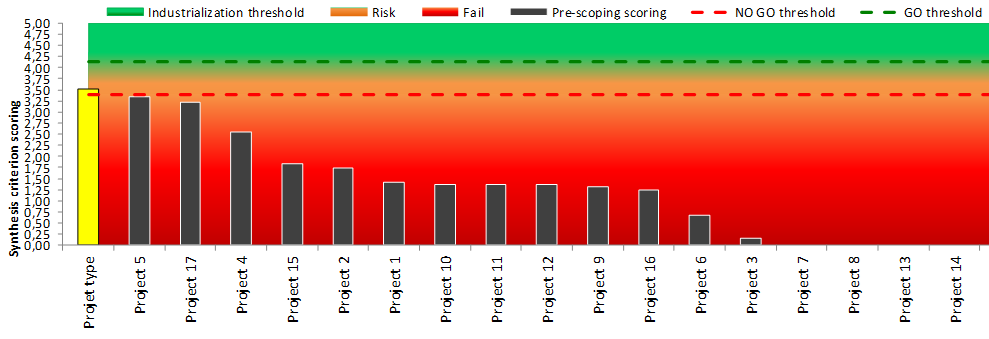
Illustration 4. Prediction and scheduling projects according to their design criterion
If a project is below the No-go threshold, the project do not start. If the project is between the two No-go and Go thresholds, then the project can start, but it must reach the Go threshold no later than the end of the scoping step during the project plan production. The predictive score card ultimately allows the project manager to better qualify subjects by providing a rational highlight of the criteria requirement before starting a Data Science project. The objectives of profitability and efficiency being more and more demanding, we retained only projects with a high probability of industrialization.
Conclusion
Our results confirm that the five failure causes of Data Science projects identified in the various studies are discriminating. By formalizing a model to predict the Data Science industrialization projects through a « predictive score card« , it is possible to significantly improve the project managers’ decision-making during the pre-scoping phase. The qualification process of Data subjects is thus optimized and levers for projects that works in progress can be proposed. The use of this « predictive score card » requires a standard application of good practice, integrated into the training courses of project managers, in order to avoid any bias during the rating of projects.
The model now built on a small learning base, due to the recent application of Data Science in industrial settings, could be significantly clarified by scoring many other projects without altering anything at all to the methodology in itself.
By confirming that highly qualified projects succeed in passing the industrialization stage and that, subject to a certain managerial courage, the abandonment of low qualified subjects avoids launching projects without real added value, we hope having demonstrated interest in rationalizing practices to extract the long-awaited « value » of Big Data projects.
Bibliographie
Aufray, C. (2015). Big Data : peu de projets, le plus souvent des échecs. Spotted at http://www.zdnet.fr/actualites/big-data-peu-de-projets-le-plus-souvent-des-echecs-39813301.htm.
Balasubramanian, A., Kaur, K, Libarikian., A, and Noor Narula. (2017). Raising returns on analytics investments in insurance. Spotted at https://www.mckinsey.com/industries/financial-services/our-insights/raising-returns-on-analytics-investments-in-insurance.
Blokdyk, G. (2018). Data Ops (3 ed). 5STARCooks.
Capgemini. (2015). Big & Fast Data: The Rise of Insight-Driven Business. Spotted at https://www.capgemini.com/wp-content/uploads/2017/07/big_fast_data_the_rise_of_insight-driven_business-report.pdf.
Chapman, P., Clinton, J. et Kerber, R. (2000). Step-by-step data mining guide. Spotted at https://www.the-modeling-agency.com/crisp-dm.pdf. Colin Shearer (SPSS) and Rüdiger Wirth (DaimlerChrysler).
Fléchaux, R. (2017). Projets Hadoop : un échec dans 70 % des cas. Spotted at https://www.silicon.fr/projets-hadoop-echec-70-cas-169110.html.
Galiana, D. (2017). 6 causes de l’échec d’un projet et les solutions pour y remédier. Spotted at https://www.planzone.fr/blog/causes-echec-projet-solutions-pour-remedier.
Gandomi A. et Haider M. (2015). Beyond the hype: Big data concepts, methods, and analytics. International Journal of Information Management, 35 (2) (2015), pp. 137-144.
Lefebure, R. (2016). Facteurs d’échec des Projets Big Data. Spotted at http://www.blog-crm.fr/non-classe/limportant-taux-dechec-projets-big-data-il-faire-reculer-les-entreprises/.
McCormick, J., Hopkins, B. et Schadler, T. (2016). The Insights-Driven Business. Spotted at https://www.visioncritical.com/wp-content/uploads/2017/06/Insights-driven-business-forrester.pdf.
McKendrick, J. (2018). The Looming Industrialization of Data Analytics. Spotted at https://blogs.informatica.com/2018/03/01/looming-industrialization-data-analytics/#fbid=0drWG9-sjw5.
Potelle, H. (2018). Les principes de l’excellence Data. Spotted at https://www.linkedin.com/pulse/les-principes-de-lexcellence-data-herv%C3%A9-potelle/?published=t.
Ronanki, R., Verma, A., Pierce, D., Shilling, M. (2016). Industrialized Analytics: Data’s New Potential. Spotted at http://deloitte.wsj.com/cio/2016/04/27/industrialized-analytics-datas-new-potential/.
Tufféry, S. (2012). Data Mining et statistique décisionnelle. (4e éd). Paris, France : Technip.
Vaillant, F. (2018). Big data : des projets rentables plutôt que des big projets. Spotted at https://www.forepaas.com/fr/big-data-des-projets-rentables-plutot-que-des-big-projets/.
Voguels, W. (2017). Rethinking the ‘production’ of data. Spotted at https://www.allthingsdistributed.com/2017/12/rethinking-production-of-data.html.
Zaïdi-Chtourou, S. (2018). Effet du volume des données sur la qualité des décisions marketing. Management & Data Science, 2(1), 18-30.
Évaluation globale
(Pas d'évaluation)(Il n'y a pas encore d'évaluation.)
(Il n'y a pas encore de commentaire.)
- Aucune ressource disponible.

02
Oct
2018
How to succeed in data science projects industrialization ?
Hervé Potelle
MCEInvité
Data Project Manager • PSA Group - Digital Direction
Laurent Leblond
MCEInvité
Expert en Statistiques Industrielles • PSA Group - Division Qualité